 Your new post is loading...
Henry Blodget's presentation of The Future of Digital is a mammoth slideshow with some delicious nuggets. The three-word takeaway is "Money follows eyeballs." If you want to know where the money is going, follow our attention.That makes this graph, adapted from the widely shared (and occasionally maligned) Mary Meeker presentation, perhaps the most important of the slide. It shows consumer attention vs. U.S. ad spending....
To be truly successful in marketing and advertising, we need to understand human motivation and behaviour at a deep level so that we are more able to influence it. Yet the marketing industry has clung to the same frameworks for modelling the ways that people evaluate information and make decisions for decades.
That picture is changing quickly as thinking from the worlds of economics and psychology creep into marketing. A discipline called behavioural economics, in particular, is challenging many of our old assumptions and helping us to think about how our customers behave in totally new ways...
Does your least favorite shirt fit you too tightly in the shoulders but too baggy on the belly? That’s data. Do your breasts pop out of your bra and the straps dig in too tight? That’s data. Are sleeves strangely loose on you? That’s data.
The data trend that has overtaken everything from job recruiting to sales leads has finally made its way into an unexpected place: the world of Anna Wintour. That’s right. Big data has arrived in Fashionland.
There’s multiple already funded Kickstarters underway right now, all that use data to produce perfectly fitting men’s t-shirts, in 24-50 unique sizes for all fellas of all shapes and sizes....
Insights from big marketing data can be leveraged to create compelling experiences tailored to individual behaviors and preferences. By accurately processing and "actioning" big data, marketers can customize individual messages at remarkable scale.By taking the time to leverage your company's existing big data assets and following three simple steps, you can deliver personalized marketing that can grow sales this year...
For the first time ever, a Forrester survey on Internet usage found that users report spending less time online than they did in 2011, nearly back to the average duration reported in 2009.
Forrester had this to say on the subject:... “Our analysis revealed that “being online” is becoming a fluid concept. Consumers no longer consider some of the online activities they perform to be activities related to “using the Internet.” …
The Internet has become such a normal part of their lives that consumers don’t register that they are using the Internet when they’re on Facebook, for example. It’s only when they are actively doing a specific task, like search, that they consider this to be time that they’re spending online.”
Not only does the data show a decline in reported Internet usage, it also demonstrates a decline in the number of (US-based) consumers who own a laptop, netbook, or desktop. The data shows that smartphones and tablets are primarily used (in relation to the Internet) to access social networking websites, while consumers still prefer either a laptop or a desktop for performing other, more “serious” tasks.
This delineation between PC and mobile device usage may indicate that Internet users don’t consider the times they pull out a smartphone or tablet as “being online,” but rather only when they sit down and perform a specific Internet-related activity on the computer....
The volume, velocity and variety of data created in the modern digital world is truly astounding. Here are some facts and figures that illustrate that point...
Here at eSpatial we are very interested in the subjects surrounding big data, data management and data visualization. After all, our goal is to help businesses and organizations make the most of data of any kind by turning it into engaging and useful visuals. (You can see examples of how we do this here.)Here are some facts and figures I’ve come across in the last while that illustrate that point.
- The volume of data created by U.S. companies alone each year is enough to fill ten thousand Libraries of Congress. (Source) - According to McKinsey – a retailer using big data to the full could increase its operating margin by more than 60%. (Source) - Zuckerberg noted that 1 billion pieces of content are shared via Facebook’s Open Graph daily. (Source)...
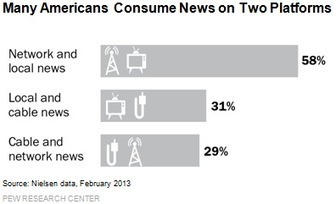
Even at a time of fragmenting media use, television remains the dominant way that Americans get news at home, according to a new Pew Research Center analysis of Nielsen data. And while the largest audiences tune into local and network broadcast news, it is national cable news that commands the most attention from its viewers.
Almost three out of four U.S. adults (71%) watch local television news and 65% view network newscasts over the course of a month, according to Nielsen data from February 2013. While 38% of adults watch some cable news during the month, cable viewers—particularly the most engaged viewers—spend far more time with that platform than broadcast viewers do with local or network news....
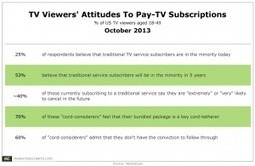
While media industry execs believe that over-the-top (OTT) services will supplement rather than replace pay-TV, TV viewers themselves believe that pay-TV will be largely replaced by alternative viewing sources in the next 5 years, according to survey results from MarketCast. Currently, (a seemingly-high) 25% of respondents believe that traditional TV service subscribers are in the minority.
In 5 years, though, 53% believe that TV viewers subscribing to the traditional model will be in the minority. That would require a huge increase in cord-cutters, estimated to last year comprise just 1.1% of pay-TV households....
Social media sites like Facebook, Twitter, Pinterest, LinkedIn and Google+ have become the epicenter of marketing campaigns for many businesses.
According to Social Media Examiner, “83% of marketers indicate that social media is important for their business.” While the act of posting content and interacting with followers is important, it’s even more important to measure the performance of your overall campaign. Doing so should ultimately help fine-tune your efforts, minimize mistakes and increase exposure.
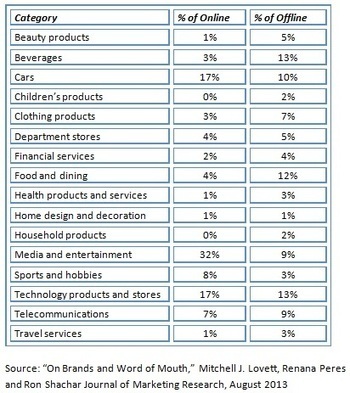
Robust new study shows drivers of word of mouth differ considerably for online vs. offline word of mouth, emotions tend to rule more offline with friends. These findings are significant for brand marketing decisions.
It has been well documented by now that word of mouth and social media are significant forces in the consumer marketplace. Word of mouth is the most trusted source of information for consumers around the world according to Nielsen, and there is now measurable proof that social voice drives product sales both directly and indirectly. Further, we at Keller Fay have produced research that continues to surprise people: While many assume the rising power of word of mouth is linked to the rise of social media, only 10% of conversations about products, services and brands take place online while 90% still occurs offline — at home, work, or when gathering in social settings of various sorts.
A new academic study provides the most comprehensive analysis ever undertaken of the consumer motivations and brand characteristics that lead people to talk online and offline and reveals significant differences between the two. According to the research, “Online data does not reflect well the offline behavior. Word of mouth is not channel neutral. One cannot automatically generalize the results from online to offline.” This suggests it is critically important for marketers to understand when digital strategies for motivating word of mouth are appropriate and likely to be effective, and when offline strategies are most appropriate....
"People tell you who they are, but we ignore it because we want them to be who we want them to be"-Don Draper
Via Robin Good, Guillaume Decugis
Get tips on how to improve your social media marketing that all stem from real research and data.... ... As a professional social media scientist and part time unicorn hunter, I spend a lot of time chasing down and busting social media unicorns-and-rainbows myths and superstitions -- advice that has no basis in facts -- with real data and science. I've conducted quite a bit of research about social media marketing, and as a result, I've gotten quite a lot of insight into the tactics that do and don't work. So I decided to compile a SlideShare highlighting 20 of my favorite data-backed ways to make your inbound marketing efforts in social media more successful. Check it out, and share your favorites using the tweet links below!...
Social media is a great way for businesses to market their products and services and to increase awareness of their brand. However, social media marketing is often a long-term play that does not generate an immediate increase in sales. In fact, it may not be obvious that social media is helping you at all for quite some time, and you may be wondering why you should even bother continuing to implement your social media marketing strategy. Before you give up on social media altogether, consider these measures for evaluating the impact that your social media campaign is having on your business — or the potential impact it will have on your business...
|
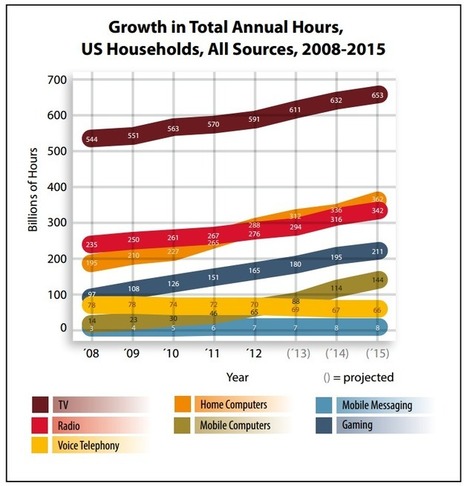
Just two statistics from this most recent technology and media research study......
- By 2015, the data indicate that Americans will consume media for more than 1.7 trillion hours, an average of approximately 15.5 hours per person per day. The amount of media delivered will exceed 8.75 zettabytes annually, or 74 gigabytes — 9 DVDs worth — of data sent to the average consumer on an average day.
- Mobile messaging hours, which in 2012 accounted for approximately 9% of voice call hours, will double to over 18% of voice hours, a year over year growth rate of more than 27%....
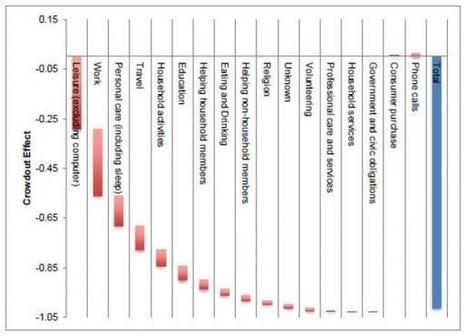
[The Washington Post] If you’ve ever suspected the Internet is taking over your offline life, an economist has some disheartening news for you: It is....
Scott Wallsten, a senior researcher at the Tech Policy Institute, parsed through the American Time Use Survey and analyzed the Internet’s “crowding-out” effect — what things we do less of so we can spend more time online. His findings, released this month in a working paper for the National Bureau of Economic Research, were pretty dramatic. For every minute people spend on “online leisure time” — i.e., not working or checking e-mail — they also spend significantly less time on other common activities....
When you know more, you can do more. Social Media’s ROI can be tracked. But keep in mind that tracking is only the measurement of the result of your efforts. You must be able to tie those results back to your objectives to get real return on investment.The following are Facebook objectives and results we track here at Kruse Control on a weekly basis...
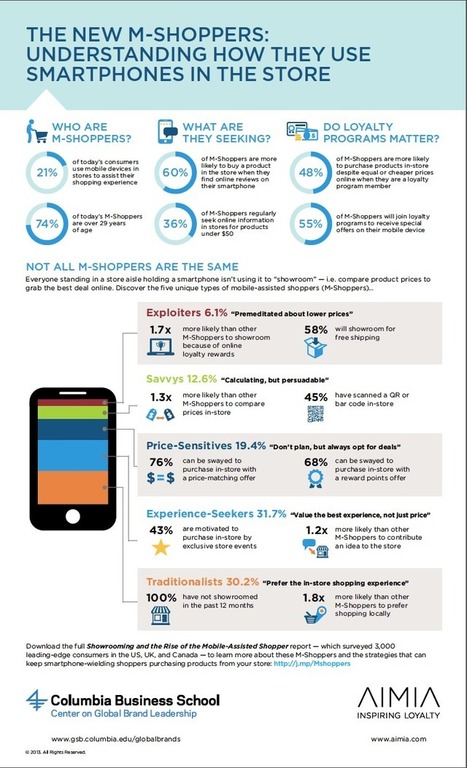
Aimia has released a report on mobile shoppers, from those who routinely use devices for research (Exploiters) to those who are more influenced by in-store experiences (Traditionalists).
Mobile-assisted shoppers (or m-shoppers) are a relatively new species in the retail jungle: 21% of today’s consumers use mobile devices in stores to assist with their shopping, according to a new report from loyalty management company Aimia.
The study, which surveyed 3,000 consumers in Canada, the U.S. and the U.K., reveals five groups of shoppers who use mobile in varying degrees when it comes to making purchase decisions online and in-store. Below is a snapshot of who these mobile-savvy consumers are, what makes them tick and the implications for retailers...
A few months ago a report from YouGov reported a "large increase" in the number of UK consumers who had stopped using social media because they'd had enough of social media.
Another report in the US found consumers not liking the large number social workers on the Internet.
...The survey asked participants aged 16-54 to rate the extent of their agreement with the statement that there are too many companies involved in social networking. Within the US, almost half – 47.1% – of respondents who had been active on any type of social network in the previous 6 months indicated some level of agreement. Just 18.6% disagreed.....
This just in: Your customers are no longer trapped on the receiving end of your value chain. With instant access to peer reviews, competitor offerings, and prices, they’re advocating for new products and services while openly and instantly communicating their likes and dislikes.Thanks to technology, customer passivity is a thing of the past. And they’re exerting their new-found power through 4 major trends...
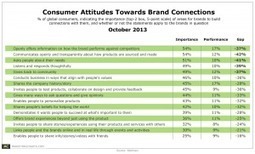
Brands are failing to perform in the areas consumers deem most important to building and maintaining connections with them, details a new study from Edelman.Brands are failing to perform in the areas consumers deem most important to building and maintaining connections with them, details a new study from Edelman. The researchers surveyed 11,000 online consumers who reported participating in a minimum of one brand engaging activity (such as following a brand on Twitter) in the previous year. The study, which took place across 8 countries and measured attitudes to the performance of 48 multinational brands and about 30 “local” brands per country, identifies some areas where brands are far behind in meeting consumer needs.
The biggest gap between importance and performance came in the area of “communicating openly and transparently about how products are sourced and made.” While 54% of respondents considered that an important area (top-2 box on a 5-point scale) for brands to build and maintain connections with them, just 12% on average believed that the statement applied to the brands in question....
...What is getting lost in all this digital hype (or not), is that marketing is a layered set of objectives, messages and channels. The marketing guru Philip Kotler defined the product at three levels: its core proposition, the supporting benefits, and the ancillary elements such as distribution. One leading media buyer explained to me recently that his company now plans around sixteen different channels, each with a different objective. And each must reflect the overall brand concept, while demonstrating the (dreaded) ROI to the client.
One of the attractions with digital is that is measurable, but one must ask (and this is part of the challenge being put up by the marketers) are we measuring the right thing? Fantastic that 10 per cent of users click through, but if the number of users is only 20 per cent of those that could be reached through conventional means, does the math ad up?...
There are many things that influence human behavior and color is definitely one of them. The effect is often so subtle that we have no conscious realization that we are being influenced by color...
Research shows however, that color can actually influence buying behavior. In fact, color has the power to evoke strong emotional responses and depending on your culture and your geographic location, using the wrong color could be enough to turn potential and existing customers away from your business. As a result many marketers, like myself, have studied the meaning of color and the psychology behind color. So let’s take a 50,000 foot view of color and give you some tips to help you influence customers the right way....
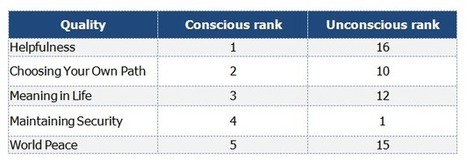
A new study by Y&R and Dr. Joel Weinberger of Adelphi University shows that consumers' unconscious desires are at odds with what we say we want.
Ad firm Y&R teamed up with psychologist Dr. Joel Weinberger of Adelphi University to design a study that revealed respondents’ subconscious preferences using implicit association testing. The study, tellingly named “Secrets and Lies,” has been released and is available here.
Three key findings:
1. What consumers say is important is often the opposite of what truly is important to them.
In the chart below “conscious preference” is what people said they held to be of value. “Unconscious preference” shows how testing determined what they actually, subconsciously, valued. These global responses came from Brazil, China, and the US...
We decided to experiment with a new, super-long article format akin to "slow live blogging." When we looked at the traffic charts below, our jaws dropped. Here's what we learned about long form stories--and why quality, not velocity, is the future of online news. As web publishers we're obsessed with analytics. Any strategy that moves the needle gets our attention. So you can imagine my surprise when a new way of writing articles blew up my assumptions about how to drive traffic. Before I go on--looking at analytics is tricky. Because we have imperfect information about our audience, it can be difficult to translate aggregate reader behavior into real insights. We may see trends or correlations in the data, but they do not necessarily imply causation, and trying to analyze traffic too closely can coax editors and writers into an unhealthy diet of red herrings. Sometimes, though, a trend is so big and consistent that it's impossible not to engage in a little educated speculation. The last month of our traffic at FastCo.Labs has presented is with one such scenario....
New research into social media behaviour has been unveiled, finding that Twitter and Facebook users fall into one, or more, of 12 distinct social media personality types. The personality types are based on the results of a month-long, fly-on-the-wall experiment – where people’s online behaviour was monitored constantly for four weeks – and on an associated nationwide survey examining people’s social media attitudes and behaviours....
|


![20 Data-Backed Ways to Upgrade Your Social Media Marketing [SlideShare] | Public Relations & Social Marketing Insight | Scoop.it](https://img.scoop.it/pKfmDj0L0HLuUVZgmQZrKTl72eJkfbmt4t8yenImKBVvK0kTmF0xjctABnaLJIm9)


Valuable insight for marketing and PR pros.