Your new post is loading...
Generation Z represents the first generation of the 21st century, and is comprised of America’s youth–those aged 2 to 19. This diverse group is already making an impact with marketers, especially the sweet spot of tweens and teens aged 11-16.Here are three facts you need to know about Generation Z...
In a 2014 survey conducted by McKinsey & Company and the ANA, B2B and B2C marketers revealed the real forces disrupting marketing effectiveness today. Below is a summary highlighting the results.
Although psychology has been an integral part of marketing for many years, in recent years we have seen it become an even bigger component as more and more consumers turn to the Internet for information. In its most basic definition, psychology is the science of behavior and the mind. As online marketing develops and grows out of consumer demand, so does psychology and an understanding of how consumers think and behave as they use the Internet for purchasing decisions.
How does psychology work in the process of lead conversion? First, let’s gain a better understanding of lead conversion in online marketing, specifically inbound marketing. As you may know, call-to-actions (CTAs) and landing pages are an integral part of lead conversion and inbound marketing.
We are thrilled when we get positive reviews – it’s a reaffirmation that the investment we’ve made in the customer’s experience has been worthwhile. But correspondingly when we get negative reviews, that’s why it can feel so personally wounding.
Yet to truly exploit reviews, it is essential to look at all of them – whether they’re good or bad. To do this, we need to understand shopping psychology, to see the reviews through our customers’ eyes so we can strategize accordingly....
Over the past two weeks we conducted a series of four webinars that collectively comprise theHooked On Customers Summit. Over 260 people attended.
The eight speakers and I packed an incredible amount of insight into just four hours. I thought it would be interesting to try to choose one key insight from each speaker. So without further ado, here are my 9 top insights from the Summit. Thanks to all our speakers for a phenomenal job!...
A new study of top e-commerce websites found these practices—called discriminatory pricing or price steering—are much more widespread than was previously understood.
The study, by a team of computer scientists at Northeastern University, tracked searches on 16 popular e-commerce sites. Six of those sites used the pricing techniques; none of the sites alerted consumers to that fact.
Among the study’s findings: Travel-booking sites Cheaptickets and Orbitz charged some users searching hotel rates an average $12 more per night if they weren’t logged into the sites, and Travelocity charged users of Apple Inc.’s iOS mobile operating system $15 less for hotels than other users....
For the past three years, Google’s Zero Moment of Truth has been a pillar of the automotive industry.
The interesting finding is that we don’t tune out everything. Instead, we, as consumers, have become extremely skilled at passing by the information we don’t find relevant and grabbing the information we do. Our study shows that even though the average car shopper is exposed to dozens of sources, they’re actually only influenced by about six or seven, and that’s the reason why.
More importantly, of those six or seven influencing sources, only one or two sources (i.e., platforms, websites, experiences) are used as primary decision making tools. Meaning that when a consumer finds a tool that meets their needs for a specific task, they depend on it almost exclusively....
The demographics of who's on what social network are shifting — older social networks are reaching maturity, while newer social messaging apps are gaining younger users fast.
In a new report from BI Intelligence, we unpack data from over a dozen sources to understand how social media demographics are still shifting.
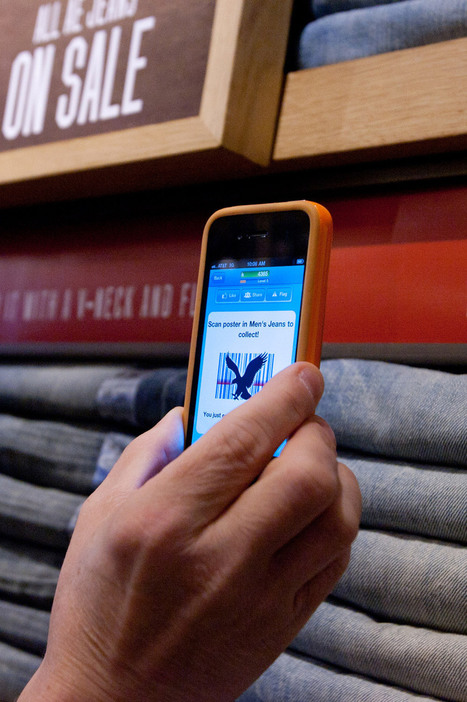
More than one out of every three (35 percent) shoppers today use mobile devices as part of their purchasing process, a 10 percent hike from 2012, according to new results from a shopper behavior study. Much of the change comes from sharp increases from three demographic groups: Hispanics, Asian-Americans and the rather wide age range of 15-49.
To be fair, the new stats from the 2-year study by the Integer Group and M/A/R/C Research explore any role a mobile device would play, including research (price comparisons, searching for products) both instore and offline.
That’s certainly legitimate when exploring the total impact of mobile devices on shoppers, but using an Android at home to verify the exact address of the nearest Home Depot is a far cry from using Apple Pay to make a purchase.The study does make it clear, though, that mobile use of almost every kind is increasing. Not surprising, but worthy of note....
It's the great American pastime.
No, I'm not talking about baseball. Or stuffing your face with apple pie. Or arguing about politics with your family over Thanksgiving dinner. No, I'm talking about the great American pastime of buying stuff.
Unlike those other pastimes, however, which have remained relatively unchanged over the years, the way we buy has evolved considerably. For example ...
In 1914, you might've been tempted to buy a (non-branded) pastry after noticing a delicious smell emanating from the local bakery.
In 2014, you might be tempted to buy a Pop-Tart after seeing a commercial for Pop-Tarts on TV, or after reading an article about Pop-Tarts on The Wall Street Journal website, or after hearing about (or attending) a Pop-Tarts-brandedsummer concert series....
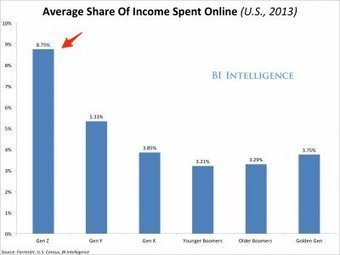
It's important for retailers to know who their potential customers are online — and what they're interested in — to market to them effectively.
BI Intelligence finds that there are surprising and important differences in behavior depending on gender, age (especially for Generation Z), income, and education. Generation Z, those aged 18 to 24, spends almost one in ten of their dollars online.
And they are spending a much higher proportion of their income online compared to other generations....
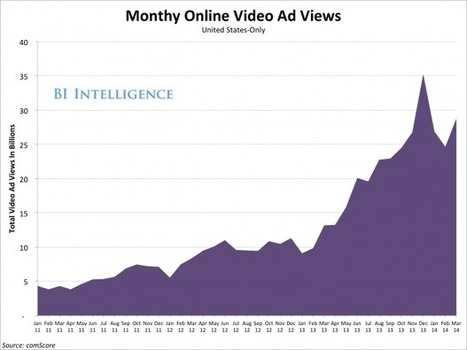
The online video ad industry is exploding as TV ad budgets go digital. Online video ads reached over 35 billion views in the U.S. in December of last year.
...Here are some of the key trends we explore in the report:
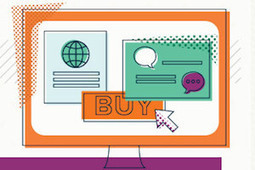
Price still rules as an online purchase influencer, but basic brand assets should not be ignored in online product presentations.
Clear, concise, and pertinent product descriptions make online shoppers press the “Buy” button more often than do favorable reviews. In fact, only price topped persuasive product copy as a purchase influencer, according to a survey of 500 consumers conducted by Markettree for HookLogic.
Price remains king, with 84% of consumers designating it as one of the top three factors that cause them to buy. Sixty-three percent named product descriptions, and 49% listed reviews. Bringing up the rear were videos, named by only 12%. Fundamental brand assets like product names, images, and features, maintains HookLogic's survey report, are the bottom-of-the-funnel items most likely to turn browsers into buyers....
|
At a 1982 planning retreat, someone on the Mac team, “thought they should do some market research to see what customers wanted. ’No,’ [Jobs] replied, ‘because customers don’t know what they want until we’ve shown them.’”
Henry Ford famously stated “If I had asked people what they wanted, they would have said faster horses.”
I agree with the sentiment behind both these quotes. Asking consumers what they want is poor research and just plain lazy. Where I disagree is when people trot out quotes like this as justification for dismissing market research as a valuable tool in the innovation process. In reality, these quotes highlight two common pitfalls of poor market research in the world of innovation and growth strategy....
Shoppers today are overwhelmed with choice. Wherever they go they are overloaded with information, forced to choose between competing offers at almost every hour of the day.
But if vendors are offering all this extra choice to increase buyer satisfaction, they might well be making a mistake. Neuroscientists believe that increasing the comparisons available may actually reduce happiness, for the simple reason that people tend to regret the decision they made because of the additional options they couldn’t pick....
comScore's experts predict desktop ecommerce to reach at least $53 billion while mobile is expected to bring in nearly $8 billion. Overall that indicates a 16% increase in spending over the 2013 holidays. Since Q4 of 2010, ecommerce growth has increased at least 10% Quarter over Quarter.
"The 2014 online holiday shopping season is shaping up to be a bright one with more than $61 billion in spending expected, representing a year-over-year growth rate of 16 percent across desktop, smartphones and tablets," said Gian Fulgoni, Executive Chairman Emeritus of comScore....
A recent survey by consulting firm Accenture found 63 percent of consumers plan to use a laptop or home computer to make purchases or research items this holiday season, up 16 percentage points from last year.
The smartphone, in particular, is gaining ground. As of August, 174 million people in the U.S. owned one — 72 percent of the mobile market, according to Reston, Va., digital tracking firm comScore. Branding Brand’s research found that mobile devices generated more than half of online retail visits that month, up from 4 percent in 2010.
The digital world generates data even better than sales, so there’s plenty of information on how Americans are using their tech tools.
Accenture’s survey found 24 percent of consumers plan to use a smartphone while shopping, up from 18 percent last year. Almost half of those surveyed are already using or at least would be willing to try services like ApplePay and PayPal that let them use their mobile phone to pay at checkout....
The Google Consumer Barometer helps users discover how often people go online, how many connected devices they have, and how they purchase online.
The Google Consumer Barometer gives marketers, retailers and producers very recent insights into how people behave online when they are researching a product category and also when they buy products online.
Anyone can use the free Google Consumer Barometer, and if you want you can create and download customised data and market-specific information.
The Google Consumer Barometer helps users discover everything from: how often people go online, to how many connected devices they may have, how people research and purchase online, how people are watching online videos or the differences between generations and their online behaviour....
Dear Mona, Is the express lane in the grocery store always the fastest lane? Barry, 44, New York.
...That’s what Wes Stevenson, a professional data analyst, did out of sheer curiosity. To test the difference between single and multiple lines, Stevenson quantified a few assumptions (10 cashiers, an average wait time of 3 minutes) and put them into his model to see what it would spit out.
He found that the wait time in single lines is more predictable (you can see that in the chart below, where there’s a narrower spread of outcomes). More importantly, though, Stevenson found that a single line is more likely to mean a shorter wait (also visible below, where the single-line chart clusters farther left than the multiple-line one, meaning that more of those 10,000 simulations produced a shorter wait time)....
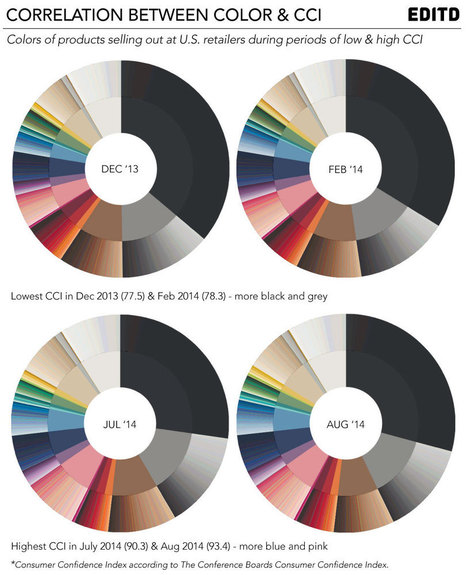
How can retailers optimize on the Consumer Confidence Index? We reveal patterns in color and pricing that change with the economic outlook.
With EDITD’s Color Analytics tools, it’s possible to view commercial activity by color. The lowest the CCI has been in the last ten months was December 2013, and the second lowest was February 2014.
Interestingly, products which sold out during those two months have something in common – there’s a huge dominance of black and grey tones. Certainly there’s some seasonality around this, but the activity in December is noteworthy – not only is this gifting and party season, but a time for sales. In February, as new season products arrive into store, it is usual to see some uplift in the palette – but with low CCI, none was evidenced....
In this study, a survey of 600 digitally savvy consumers and marketers commissioned by Kitewheel, a real-time marketing hub for agencies, 80 percent of consumers said they will search the web, conduct product research, read reviews and compare prices between different retailers at least 75 percent of the time before purchasing.
The fact that the customer journey involves many more touchpoints now isn’t news, but it’s worth repeating because this change is fundamental to how marketers adapt user experiences across all channels....
A study released by the Acquity Group, part of Accenture Interactive, has found that 94 percent of B2B buyers conduct some research before making a purchase, with 55 percent of them doing so for at least half of their purchases.
XThe “State of B2B Procurement” report looked at 500 B2B procurement officers with annual purchasing budgets of approximately $100,000. The goal was to determine how B2B companies adapt and stay competitive through their purchasing decisions.
About 68 percent of B2B buyers purchase goods online, compared to 57 percent cited in the 2013 version of the study. Nearly 44 percent of respondents said that they researched goods and services on a smartphone or tablet over the past 12 months....
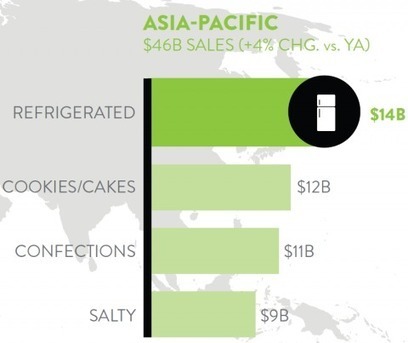
Americans snack on potato chips, Europeans munch on candy, and Latin Americans love cookies.
A new comprehensive study released today by Nielsen, which looks at snacking habits around the world, illuminates quite a few quirks about how, when, and what the world snacks on.
There are overarching trends at play. For instance: the fact that snacking is not only big, but growing. All around the globe people are eating more snacks, and more often, each year. The global snacking market, which grossed nearly $400 billion in the 12 months ending this past March, grew by another 2 percent from the year prior, and is projected to continue growing for the foreseeable future....
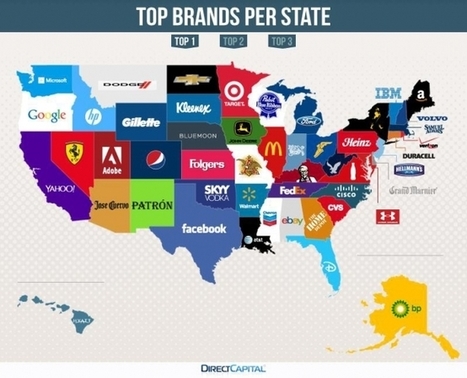
Like it or not, your surroundings inform the special little bubble you live in. Just when you thought you couldn't be stereotyped, well, here are some handy maps that define each state by the brands they Google the most.
The results are pretty fascinating, too, from the obvious to the surprising. I had no idea Grand Marnier was so popular in Delaware, or that American Eagle was so in vogue among West Virginians. Less surprising results are Microsoft in Washington and Disney in Florida.
Where it gets super interesting is when competing brands bubble up in adjacent states, like Jose Cuervo and Patron in Arizona and New Mexico, or Dodge and Chevrolet in Montana and North Dakota....
86 per cent of internet users dislike online ads targeted using cookies, finding them intrusive and irritating, according to a new report.
The study, by Intent HQ, surveyed over 2,000 consumers, and found that ads which used information gathered from social logins were preferred, provided that brands were honest about how they had gathered and planned to use the data.
59% of respondants said that providing basic login details in return for personalised offers and information was a “fair deal”.You can find all this information and more on the infographic...
|