 Your new post is loading...
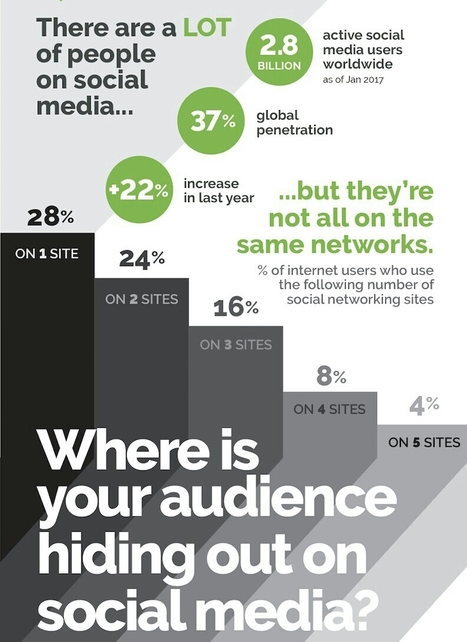
When marketers develop their social and mobile strategies -- which we strongly encourage you to do, if you haven't already -- these are important questions to ask. After all, you want to reach the right audience. So in addition to determining your buyer personas, you have to know where to find them. Not all of them are going to be using Instagram, for example. Luckily, our friends at Tracx compiled all of that information into a handy infographic that breaks down the state of social media demographics -- who's using which social network, and for what. With this information, figuring out how to best reach your personas on social media doesn't have to be such a daunting task. So read on, and start distributing your content in the right places....
Here’s an interesting stat – according to a Pinterest survey of 2,500 Pinners (conducted in May this year), 45% of users are active on the app while watching TV.
That’s surprising – normally it’s Twitter that’s identified as the ultimate TV viewing companion in social, given its position as the home of real-time conversation, particularly around live events.
As it turns out, Pinnners, too, love to multi-screen:
“64% of our users tell us they pay more attention to what they’re doing on Pinterest than what they’re watching on TV—and 44% of them will engage with Pinterest for the show’s entirety, regardless of whether it’s on a commercial break or not.”...
The Washington Post recently published an article about social media metrics with an alarmist headline: 6 in 10 of you will share this link without reading it, a new, depressing study says This story then predictably made the rounds in the blogosphere, from Gizmodo to Marketing Dive. The headline reads like self-referential clickbait, daring readers to click on the provocative statement so as not to contribute to what the article calls “the oft-demoralizing cesspool that is Internet culture.” The article cites a new study from Columbia University and French National Institute computer scientists that “59 percent of links shared on social media have never actually been clicked: In other words, most people appear to retweet news without ever reading it.” Whoa, if true. A Few Problems With The Story Except there are a few problems with extrapolating these findings to all links on social media. In fact, we probably shouldn’t even consider the findings to be all that bad....
.Are you struggling to connect with your customers on social networks?
Do you know where they hang out online?
To optimize your social media marketing efforts, it’s important to know who your customers are and which social networks they spend their time on.
In this article you’ll discover how to connect with your target audience on social media....
Automation anxiety reached new heights in 2013, when Carl Benedikt Frey and Michael A. Osborne, researchers at the Oxford Martin School, published a paper estimating that 47% of all U.S. jobs were “at risk” of being computerized over the next two decades. Although the jury is still out about robots stealing jobs, the pace at which AI and deep learning technologies have been advancing isn’t ebbing concerns over a future of disappearing work. As machines increasingly perform complex tasks once thought to be safely reserved for humans, the question has become harder to shrug off: What jobs will be left for people?
A new NBER working paper suggests it’ll be those that require strong social skills — which it defines as the ability to work with others — something that has proven to be much more difficult to automate. “The Growing Importance of Social Skills in the Labor Market,” shows that nearly all job growth since 1980 has been in occupations that are relatively social skill-intensive — and it argues that high-skilled, hard-to-automate jobs will increasingly demand social adeptness....
You can see an example of a hashtag used by hostgator in their tweet i.e #getrealcat.If you’re running a blog then you should have to learn the importance of hash-tags as they can bring massive traffic from social networking websites especially twitter to your blog. Its very easy to find the most trending hashtags for social media websites and I will tell you about top 5 websites which will greatly help you in finding the most popular hashtags....
You know how the song goes - "There'll be parties for hosting, marshmallows for toasting, and researching out in the show." At least, that is how we (and most marketers) sing it.
Salesforce's 2014 research revealed more than a few shining lights of marketing insights. The below infographic illustrates some of the standouts. - 86 percent of senior-level marketers agree that it's very important to create a cohesive customer journey. But only 29 percent companies rate themselves as effective at creating a cohesive customer journey. - 53 percent of CMOs say return-on-investment (ROI) is the most important metric they use to measure success.Take a look at this infographic for more insights....
We all know a picture speaks thousand words and for that reason infographics are being more popular due to its amazing information displayed in the form of images. It has the capability to capture everyone’s eye and tell them a story with engaging content and images. It’s an all in one package with text, images and creative design that come all along. It holds a great marketing potential that has the ability to attract customers. Many people click on infographics as it is more appealing and hence your web traffic is increased which is beneficial aspect for SEO.
Here we have the collection of 10 interesting infographics about social media. Let’s have a look at them below.
Social media like Facebook and Twitter are far too biased to be used blindly by social science researchers, two computer scientists have warned.
Writing in today’s issue of Science, Carnegie Mellon’s Juergen Pfeffer and McGill’s Derek Ruths have warned that scientists are treating the wealth of data gathered by social networks as a goldmine of what people are thinking – but frequently they aren’t correcting for inherent biases in the dataset.
If folks didn’t already know that scientists were turning to social media for easy access to the pat statistics on thousands of people, they found out about it when Facebook allowed researchers to adjust users’ news feeds to manipulate their emotions....
Facebook is for ice bucket challenges. Twitter is for Ferguson, Mo. That’s been the conventional wisdom in the past few months; that conversation about breaking news is happening mostly on Twitter, while people are using Facebook to share less timely — some would say less newsworthy — topics. The evidence for this conclusion has been anecdotal, which is almost always the case when you are comparing results produced by Facebook’s opaque News Feed algorithm to anything. So any time there’s a chance to dig into data that sheds light on public social sharing activity, it’s wise to seize it.
The quarterly report of consumer sharing behavior published this week by social data and sharing tool provider ShareThis offers such an opportunity. And while the data, drawn from the 450 million unique users and 2.5 million sites and apps in the ShareThis network, doesn’t directly address the ice-bucket-vs.-Ferguson question, it does provide some interesting marketing takeaways....
The number of shares an article receives has become ubiquitous in online content; widgets that show shares, tweets, pins, and +1s appear front and center on nearly every post you read (or, in this case, just to the left of this paragraph).
Just how many times does content get shared? Where do people prefer to share it? And are some publishers more effective than others at generating highly shared content? These questions are crucial to content marketers looking to understand the key components of a viral marketing success, and our recent research collaboration with BuzzSumo is here to give you some answers....
Which face do you find sexier -- the one on the left, or the one on the right?
Given that you have access to the internet -- a safe assumption since you made it to this page -- there's a good chance that you went for the faces on the left of each pair. But get this. If you didn't have internet (and weren't reading this right now), you might prefer the faces on the right.
So suggests a provocative new study showing a link between internet access and the potential mates we find most attractive....
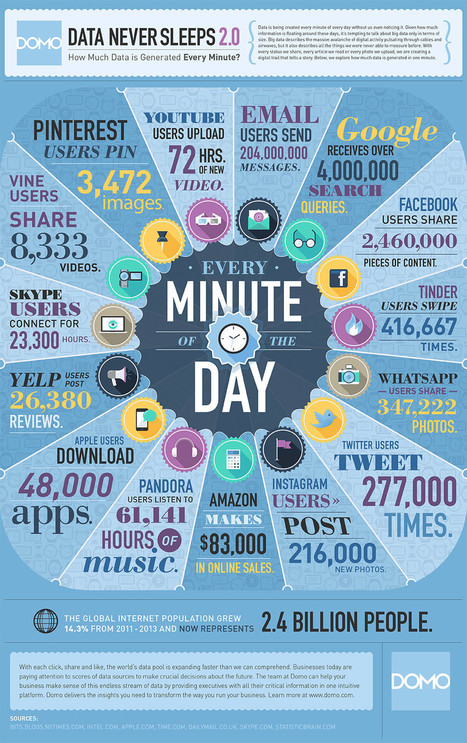
Here’s the thing: the internet never sleeps.
Which means data never sleeps, and the internet sure likes to use up a lot of it. How much? In any given minute, 277,000 tweets are published on Twitter, 216,000 photos are sent to Instagram and 8,333 videos are shared on Vine.
And we’re just getting started. Over that same 60 second period, 347,222 photos are sent on WhatsApp, 416,667 swipes are made on Tinder and 3,472 images are pinned on Pinterest.
And if you think that’s impressive, Google receives 4 millions search queries, Facebook users share 2.46 million pieces of content and 204 million email messages are sent each and every minute of the day.
This visual from DOMO looks at how much data is generated every minute across the net....
|
It's been a white-hot week so far for digital marketing statistics. We've seen numbers roll in about Reddit viewers, digital-media growth, bad ads, web bots, Amazon Echo, ecommerce and the hit film La La Land.
Check out these dozen data points that grabbed our attention:
1. Big Game versus going big on Snapchat
On Thursday, we looked at how many types of digital ads equaled the cost of a 30-second Super Bowl TV spot, which comes in at $5.6 million this year. For Snapchat sponsored lenses, 17 of them add up to one Big Game commercial. A branded lens on the mobile app, according to digital agency Essence, costs roughly $329,400.
2. Redditors love mobile reading
Reddit didn't have a mobile app one year ago today, but on Wednesday it revealed that more than 40 percent of its content views occur via its app....
This spring, we discovered that U.S. moms check Instagram as often as six times per day. But Dads áre just as active on social as Moms - the same study revealed that almost half of dads on Instagram follow businesses, and of those fathers, 69% take action from the content they see.
A new infographic from Social Media Link provides further insights and context surrounding how dads use social. The full infographic is below but here a few quick highlights. - 91% of fathers use Facebook weekly; 60% use Twitter weekly; 49% use Instagram weekly.
- When fathers do use social, they’re frequently posting about their kids - 70% of fathers share about their children at least a couple times a month.
- 61% at least somewhat agree that they use social media more now than they did before having children....
This is the gospel according to Mary Meeker, a living legend amongst venture capitalists. Instead of just blindly clicking through her 200+ page 2016..
Whether marketers like it or not, consumers are now generating over 25% of content that appears in web searches for specific brand names, and consumers often trust those social media messages more than advertising or news articles about the brand. Research has shown that this “electronic word-of-mouth” is seen as reliable by consumers and significantly affects a firm’s perceived value.
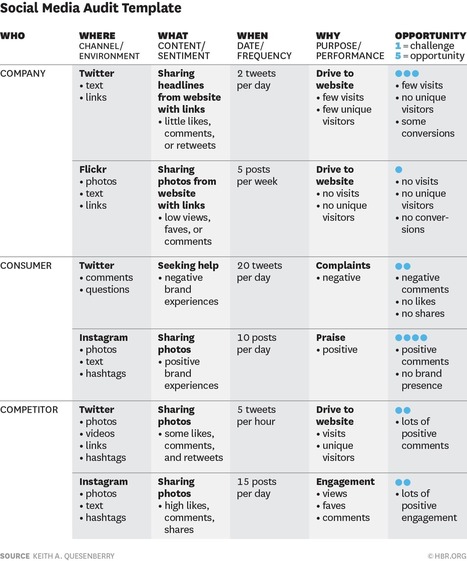
But with such a panoply of channels out there, how can social media marketers keep track of what people are saying? And what strategies can be implemented to engage those consumers to influence the conversation? That’s where a careful social media audit can help. It’s a systematic examination of social data to help marketers discover, categorize, and evaluate all the social talk about a brand. This approach captures what consumers are saying about a brand, what competitors are doing on social media, and what the brand itself is doing.
I developed a social media audit template for the book Social Media Strategy: Marketing and Advertising in the Consumer Revolution from the principle of the Five Ws that is taught to journalists: who, where, what, when, and why...
It’s been a week since #SMMW15; enough time to digest the stats and provide a summary of which we thought matters the most. This year, companies were scrambling from session to session to figure out what content people actually want, rising social media trends, and how to pack in 21 different social platforms, listening tools and rise to the top of the trends report.
Not me. I was just there for theimportant stats that really matter (or just make you smile). So, take a deep breath and a social break to add a little humor (plus some very useful stats) to your Friday....
One of the most viral and popular means of connecting with consumers in an interpersonal manner and encouraging a healthy conversion rate during the present day is via social media.
Shoppers these days are more technologically savvy than ever before, and most are using one or more social channels on a daily basis. The most current social shopping statistics shine a bright light on the real impact.
Social Referrals Generate Strong Sales
According to online think tank Statistica, in 2013 alone, there were over 157 million online shoppers that were referred by social media networks. Websites like Twitter actually boast a higher conversion rate than standard internet users, according to Media Bistro, with 75% of Twitter users making at least one or more purchases per month, as contrasted to just 67% of internet users overall.
Furthermore, a report by Sprout Social finds that about 74% of all consumers rely upon social networks to make a purchasing decision. This can range from reading a review or learning about a purchase that was made by friends; or from seeing a product favorite, liked, tweeted, pinned and shared....
Face it – it wasn’t all that long ago that you were super excited about your Motorola Razr, the word “tablet” referred to a stone slab and there was nothing “smart” about your TV.
Now, with everything from our toothbrushes to our thermostats connected to the Internet, 46% of consumers say they use multiple connected devices to accomplish a single task.
The burgeoning omni-channel landscape is changing the way that your customers interact, look for information and make decisions on a daily basis. Businesses looking to stay relevant and top-of-mind must rethink the way they structure their user experiences and manage customer data in response.
As channels continue to fragment and connected devices multiply, customer identity is becoming increasingly central to creating meaningful experiences that transcend touchpoints and grow relationships. Let’s take a look at 3 omni-channel trends and how focusing on customer identity enables businesses to build meaningful, unified customer journeys across every screen along the way....
I’m a huge fan of hashtags!
They boost my reach on social media & help me monitor what my target audience is talking about.
But I also use hashtags when brainstorming new blog ideas & optimizing content for the right marketing channels.These are the 5 types of hashtags I’ve had the most success with: - Related Hashtags
- Local Hashtags
- Event Hashtags
- Holiday Hashtags
- Brand Hashtags
In this post, I analyze how these hashtags work for me & how you can use hashtags to crank up your content marketing!...
I began this year by publishing my social media predictions for 2014 focusing on six key trends that I saw (and continue to see) evolving: Employee Advocacy, Google Plus, Paid Social, Content, The Visual, and Mobile Personal.
With the year coming to a close, it’s time to look ahead into what awaits us in 2015 and how we can spend the rest of the year better preparing for it.
Rather than just include my own predictions, as Community Manager for the CEO Registry’s SocialMedia.CEO community of social business leaders, I decided to reach out to the social media CEOs and see what their vision holds for all of us. Without further adieu, here are 10 social media predictions for 2015 from 10 social media CEOs....
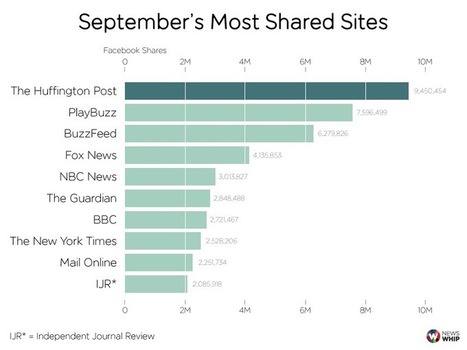
In our latest Facebook rankings, we look at the performance of the biggest sites and stories on Facebook for September 2014, and analyze the most impressive new performers. We’ve consulted Spike’s extensive social database, and have come up with new analysis and data for another month of social publishing activity.
This month: Leaders The Huffington Post have almost 53.5m total interactions. BuzzFeed (2nd) put daylight between themselves and Fox News (3rd). Mirror.co.uk breaks into the overall top ten for the first time, with 11.2m interactions. BBC News, the New York Times and the Guardian all make strong gains....
Local is the new global. Social Media Marketing expert Andrea Vahl shares tips on using the global network that is social media to get found locally!
We had fun checking social media demographics surveys from different credible sources like Pew Research Center and Burst Media and we were able to pluck out some distinct patterns that suggest women are taking over social media and we’ve turned the data into a nice infographic.
The infographic shows that women not only use social media more often than men, but they use these sites in more ways. More women also use the top social media sites and they dominate the visual-type social websites, which are the fastest growing social networks today. No site establishes women’s dominance in social media more than Pinterest, where 33% of U.S. women online access Pinterest (for men it’s only 8%).
But more tellingly is how women lead the trend of accessing social media via mobile. Forty-six percent of women use their smartphones to check their social account versus 43% for men. Likewise, 32% of women use a tablet versus 20% of men for the same reason. Now juxtapose that to the Business Insider report saying 60% of social media time is spent on smartphones and tablets, and you’ll realize women will be setting the pace towards social mobiles....
|


![Pinterest and TV Go Hand-in-Hand [Infographic] | Public Relations & Social Marketing Insight | Scoop.it](https://img.scoop.it/zVT15sOZItW9agst1e5yQzl72eJkfbmt4t8yenImKBVvK0kTmF0xjctABnaLJIm9)


![Men Use Social More After Becoming Dads [Infographic] | Public Relations & Social Marketing Insight | Scoop.it](https://img.scoop.it/qj5sCqocZWnvj1q7TIJg7jl72eJkfbmt4t8yenImKBVvK0kTmF0xjctABnaLJIm9)


Discover the who, what, and where of social media users in 2017.