Sure, articles let brands talk directly to customers about solving problems, like how to save for a home while paying off student loans, for example. Blog posts have relatively low overhead compared to, say, a national ad campaign or video product release, and in some industries such as finance, they are necessary to edge out competitors trying to capture the same audience.
But a content plan with only blog posts is like a diet that consists solely of bananas. Sure they provide some value and it’s safe to eat one per day, but without diversity you’re going to become malnourished.
The problem for many brands is they don’t have the data to justify alternative approaches that may cost more than a 600-word article.
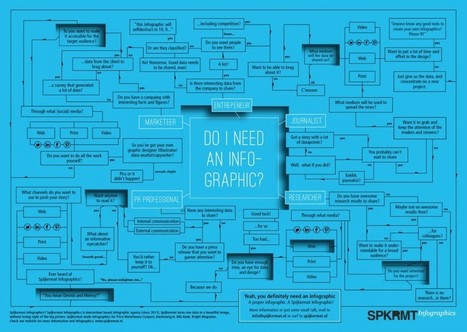
When our data scientists examined 3,200 stories produced on the Contently platform over the last year, they found that a different type of content outperforms blog posts across most industries:
- Infographics reach 54 percent more readers than blog posts.
- The median cost to reach one reader for an infographic was $0.04 versus $1.77 for a blog post.
-Infographics have a 73 percent completion rate. Blog posts have a 66 percent completion rate....


 Your new post is loading...


Brands love blog posts. But if they're serious about content marketing, they may want to focus on infographics as well. Time to rethink your blog content.