Public Relations & Social Marketing Insight
443.4K views | +0 today
Follow
Public Relations & Social Marketing Insight
Social marketing, PR insight & thought leadership - from The PR Coach
Curated by Jeff Domansky
Your new post is loading...
Scooped by Jeff Domansky
Scoop.it!

Intriguing study reveals the secrets of successful infographics

Intriguing study reveals the secrets of successful infographics | Public Relations & Social Marketing Insight | Scoop.it
What makes an infographic successful? As designers, we want it to achieve a balance of two main things: Did the reader get the message we wanted them to get?


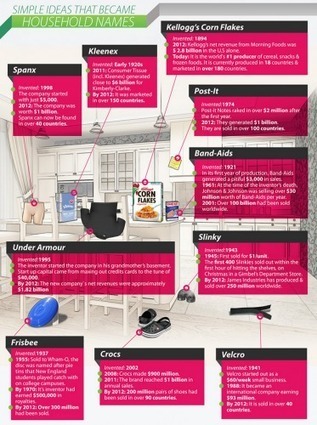
...To the surprise of the researchers, bar graphs and charts did poorly. It turns out (news flash) they all kinda look the same. The most memorable images contained “human recognizable objects.” Think mundane stuff like photos or illustrations of bottles, animals and shoes, not to mention people.


Other important points:

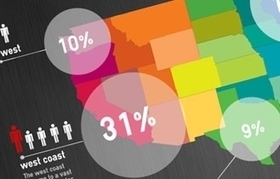
  1. Color made a huge difference: the more, the better.
  2. Images with more clutter were highly memorable. How much more memorable? A lot.
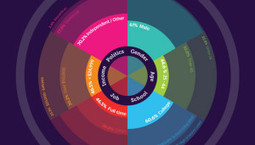
  3. Images with lots of circles and rounded corner graphics also ranked high.
Jeff Domansky's insight:

Intriguing study of what makes infographics work.

Jeff Domansky's curator insight, March 31, 2014 1:34 PM

Research worth noting for content, marketing, PR and design pros.

Scooped by Jeff Domansky
Scoop.it!

How to Leverage Infographics for B2C Marketing

How to Leverage Infographics for B2C Marketing | Public Relations & Social Marketing Insight | Scoop.it

The effectiveness of an infographic as a marketing material depends in large part on the presentation or layout. The visual appeal plus the way information is displayed can go a long way to securing a sale.


Infographics present statistical data in a more palatable manner. Basically, it delivers information as a story, in a way that’s easier to understand. That’s why data shown in these graphics are more easily retained by viewers than if they read it in a paragraph.


With that in mind, marketers can take advantage of this potential and present their products in such a way that it will remain in the minds of the consumers. One of the best ways to do that is to tell a tale....

Jeff Domansky's insight:

Content marketing with infographics.

No comment yet.
Scooped by Jeff Domansky
Scoop.it!

The Very, Very Many Varieties of Beer [Infographic] | Daily Infographic

The Very, Very Many Varieties of Beer [Infographic] | Daily Infographic | Public Relations & Social Marketing Insight | Scoop.it

...As you can see from this map, beer comes in many subtle varieties including one big divide – Lagers and Ales. I believe that what separates the lagers from the ales aside from taste alone is in the temperature at which it is fermented and conditioned. With Lagers you get your Bocks and Pilsners and Light beers. Ales are brewed at room temperature and produce your IPA’s, Stouts, and Lambic beers. Although I still haven’t tried my brew yet (I just added the sugar/alcohol content about a week ago so it’s needs to carbonate), I’m ecstatic about getting that stuff in my belly. mmmm. Next up on the brew list is an Oatmeal Stout....

Jeff Domansky's insight:

Here's a tasty bit of content marketing...

No comment yet.
Rescooped by Jeff Domansky from Hybrid PR
Scoop.it!

3 Free Tools for Creating Your Own Infographics | Entrepreneur.com

3 Free Tools for Creating Your Own Infographics | Entrepreneur.com | Public Relations & Social Marketing Insight | Scoop.it
You don't have to be a design expert or spend a lot of money to create eye-catching infographics.Get the latest blog articles on business ideas and...


[Three useful tools for DIY infographics ~ Jeff]


Via Carla Bulhões
No comment yet.
Scooped by Jeff Domansky
Scoop.it!

10 mind-blowing mobile infographics

10 mind-blowing mobile infographics | Public Relations & Social Marketing Insight | Scoop.it

I've gathered together ten great infographics on m-commerce, QR codes, apps vs web, coupons, payments, mobile marketing and more.Where possible, I've added the infographics to this post in a readable size, but for others you can click on the image to see a larger version..

Jeff Domansky's insight:

Useful resource for mobile marketers.

No comment yet.
Scooped by Jeff Domansky
Scoop.it!

The Growing Importance of Infographics | Rush Tips

The Growing Importance of Infographics | Rush Tips | Public Relations & Social Marketing Insight | Scoop.it

One of the most efficient ways to aggregate easily digestible pieces of information is through infographics. Infographics are typically stylish, scrollable graphics providing factual information on a defined and narrow topic. Infographics make learning and processing information much more enjoyable than simply reading out of an encyclopedia or from a boring black and white webpage. For these reasons, more people and businesses are turning to infographics as a way to send out important bits of information to targeted demographics.


A single infographic has the potential to reach up to 15 million people on average. The reason why infographics have such a high potential is because people have embraced linking and spreading the graphics through social media channels. Instead of sending out one fact at a time to a follower, a social media user can simply link to an infographic that has all the information he or she would like to show to followers. This makes infographics as one of the most enjoyable and time efficient ways to spread facts worth sharing....

No comment yet.
Scooped by Jeff Domansky
Scoop.it!

State of Graphic Design | Cool Infographics

State of Graphic Design | Cool Infographics | Public Relations & Social Marketing Insight | Scoop.it
Smartpress surveyed some of the best and most talented graphic designers and put the results in...


into the State of Graphic Design infographic. They include tips like “How to learn the field” and “Top 5 states for graphic designer employment” that could be crucial for newbies to the field....

No comment yet.
Rescooped by Jeff Domansky from Eclectic Technology
Scoop.it!

13 Of The Best Tools To Create Infographics

13 Of The Best Tools To Create Infographics | Public Relations & Social Marketing Insight | Scoop.it

Visual information is popular these days, and there are now many tools to help students create infographics. This post lists three infographic creation tools but also goes one step further. It provides ten data sources that you may use. 


Data is a key part of an infographics. Having this list of ten data sources opens up possibilities for students to create a more polished infographic which combines data and visuals.


[Good snapshot of infographic tools and data resources ~ Jeff]


Via Beth Dichter
Henry Lee's curator insight, March 16, 2015 9:29 PM

This lists various tools that are available to make infographics, which is a data visualization format that makes learning quantitative statistics about a topic easier for the general public to understand.