Public Relations & Social Marketing Insight
443.6K views | +2 today
Follow
Public Relations & Social Marketing Insight
Social marketing, PR insight & thought leadership - from The PR Coach
Curated by Jeff Domansky
Your new post is loading...
Scooped by Jeff Domansky
Scoop.it!

The 37 best tools for data visualization

The 37 best tools for data visualization | Public Relations & Social Marketing Insight | Scoop.it

Not a web designer or developer? You may prefer free tools for creating infographics.


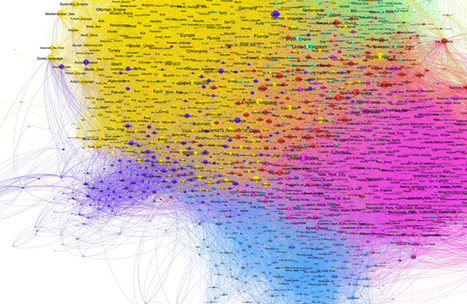
As author, data journalist and information designer David McCandless said in his TED talk: “By visualizing information, we turn it into a landscape that you can explore with your eyes, a sort of information map. And when you’re lost in information, an information map is kind of useful.”


There are many different ways of telling a story, but everything starts with an idea. So to help you get started we’ve rounded up some of the most awesome data visualization tools available on the web....

Jeff Domansky's insight:

This great list of valuable data visualization tools is recommended reading. 9/10

Winners Education's curator insight, March 26, 2015 12:24 PM

Adressing the visula part of the learning brain with easy-to-use, web-dased tools 

Vinicius Vinny Araujo's curator insight, April 17, 2015 12:55 AM

#data

Nora Morton's curator insight, April 22, 2015 6:23 PM

Colorful charts/graphs/maps are my type of eye candy!  This site illustrates the vast ways you can visually present data.  Among the many: iChart, Polymaps, Google Charts, Many Eyes, Leaflet, Exhibit, and Zing Chart. 

Scooped by Jeff Domansky
Scoop.it!

How to Make Your Data Pretty? Utilize These Data Visualization Tools

How to Make Your Data Pretty? Utilize These Data Visualization Tools | Public Relations & Social Marketing Insight | Scoop.it

Tired of showcasing the same old boring tables to your management? A spice of colors and layout brings life to data representation. If you need to understand million rows of data and you are short on time. The data might be coming from different sources and you may need to compile it to get a holistic view to make a decision on it. In order to make the meaning of the information effectively,


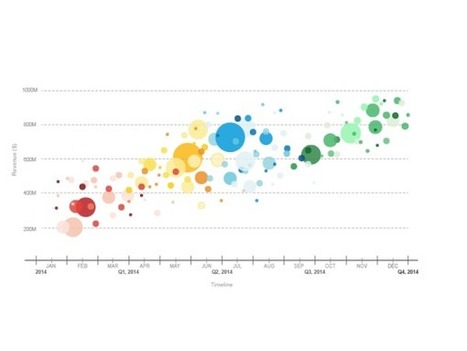
Data Visualization is an important answer.Data Visualization is an art for visual communication which enhances the expression of data in to one collective graphic for anyone to digest and action upon....

Jeff Domansky's insight:

Cool data visualization tools.

Nicolas Collignon - Community Manager Freelance's curator insight, February 19, 2015 3:40 AM
"Data Visualization is an art for visual communication which enhances the expression of data in to one collective graphic for anyone to digest"
Félix Eroles's curator insight, February 19, 2015 1:00 PM

Perfect for mi. I like it !

Gonzalo Moreno's curator insight, February 23, 2015 2:37 PM

Presenting data. Cool tools!