


 Your new post is loading...

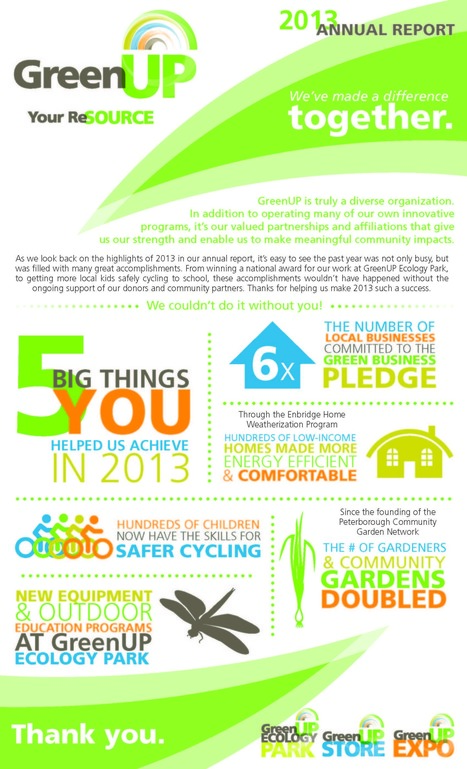

At GreenUP, it’s no different. The task of creating our annual report begins in early February, to be completed in time for our late March Annual General Meeting. The report traditionally was a four page, text-heavy document that involved facts and figures, lists of community partners and compelling photos. This year, however, we decided to do things differently.
Over the past year, the organization went through a rebranding and strategic planning process, the result of which was an increased focus on donor communications. Our previous annual reports consisted of a lot of facts and figures that showed accomplishments, but in a format that wasn’t donor friendly. We realized this had to change for the 2013 report, and wanted a document that not only clearly communicated our accomplishments, but also wouldn’t put the reader to sleep. Enter, the infographic....


Fresh approach to the annual report from GreenUP.