Via luiy
Get Started for FREE
Sign up with Facebook Sign up with X
I don't have a Facebook or a X account

 Your new post is loading... Your new post is loading...
 Your new post is loading... Your new post is loading...
|

luiy's curator insight,
June 3, 2014 8:11 AM
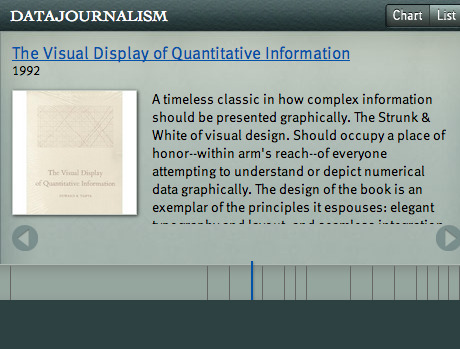
Dutch investigative reporter Henk van Ess has created this guide to data journalism in books, from 1970 to 2012. It shows how the field has changed, from 'precision reporting' to 'computer assisted reporting' to 'data journalism'. Oh and it includes our book, Facts are Sacred: the power of data (on Kindle) and the latest Data Journalism Handbook. Who is it missing? 
Charlie Garcia's curator insight,
October 20, 2015 3:35 PM
Alex Halperin shared his reflections on the media industry after visiting the Investigative Reporters and Editors conference in 2014. This article points out the new challenges facing legacy news organizations, primarily the threats from tech giants and nontraditional media sites. Halperin cautions against the assumption that legacy media will persist through simply exporting their content online. This article claims a fundamental shift has occurred within audience demands, which prefer interactive or trivial media over traditional hard news. The legacy outlets also fail to adapt their business model to online advertising, since their sites do not collect valuable personal information from readers. While Buzzfeed offers quizzes and other forms of data collection, the NY Times or AJC lacks an extensive, detailed profile on their audiences, which translates into less profitable ad revenue. The author concludes these changes will not bode well for legacy groups unless they quickly adjust their business to new tactics. |


The Open Data Barometer takes a multidimensional look at the current adoption level of open data policy and practice around the world. Three main categories are considered as part of the barometer:
- Readiness - identifies how far a country has in place the political, social and economic foundations for realising the potential benefits of open data. The Barometer covers the readiness of government, entrepreneurs and business, and citizen and civil society.
- Implementation - identifies the extent to which government has published a range of key datasets to support innovation, accountability and more improved social policy. The barometer covers 14 datasets split across three clusters to capture datasets commonly used for: securing government accountability; improving social policy; and enabling innovation and economic activity.
- Emerging impacts - identifies the extent to which open data has been seen to lead to positive political, social and environment, and economic change. The Barometer looks for political impacts – including transparency & accountability, and improved government efficiency and effectiveness; economic impacts – through supporting start-up entrepreneurs and existing businesses; and social impacts – including environmental impacts, and contributing to greater inclusion for marginalised groups in society.
These factors have been combined onto a Radar chart, this represents the countries barometer.